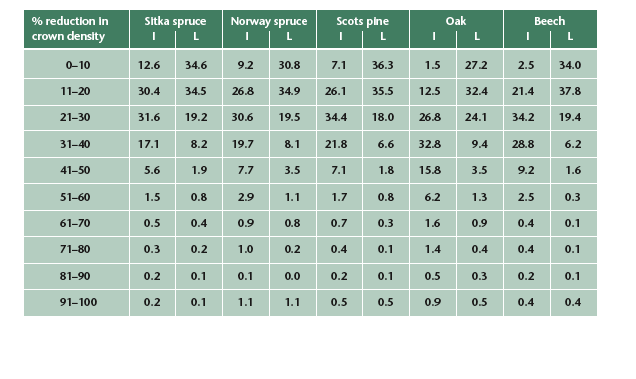
The crown density results, using both methods of assessment, are presented in 10% classes in Table 1. The marked effect of using a local reference tree rather than an ideal tree as the basis for comparison can be seen for all species. Much of the difference can be accounted for by variations in growth habit between the reference photographs of ideal trees (Innes, 1990) and the trees in and around the plots to be assessed, from among which a local reference tree is chosen. For example, young trees of all species, but particularly Scots pine, tend to have a more open appearance (i.e. a lower crown density) than the older trees illustrated in Innes (1990), and some older oaks and spruces also have a naturally open structure. For trees like this, the apparent reduction in crown density would therefore be much greater when judged against an ideal tree than when compared to local trees of the same age and form.
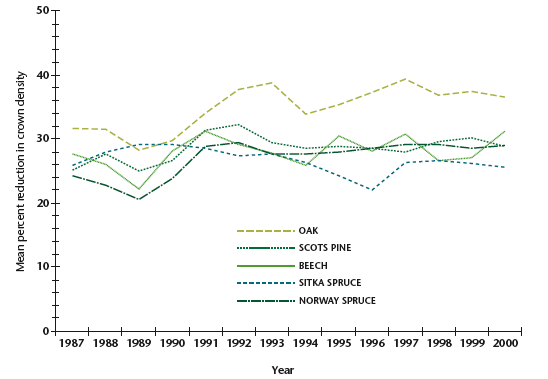
Figure 1 shows the changes in crown condition that have taken place since 1987. An upward gradient in this figure indicates a deterioration in crown condition. In contrast to the method of presentation used before 1998, the figure records the mean percent reduction in crown density for each species compared to an ideal tree. Changes in crown density compared to last year were minor for all species except beech, the condition of which deteriorated significantly. Analysis of the time series for each species shows that, in general, only relatively large changes in crown density (more than 3% to 4%) between years are statistically significant. Short-term changes of such magnitude, both positive and negative, have characterised beech over the fourteen year survey period. However, there is no evidence of a long-term deterioration or improvement of crown condition in this species. Similarly, no long-term trends can be detected in the crown densities of either Scots pine or Sitka spruce, although the latter is the only species currently in better condition than at the commencement of the survey in 1987. Analysis of the 1987 to 2000 data indicates that a statistically significant deterioration in crown condition has occurred for both oak and Norway spruce over the duration of the survey. However, the time series is of relatively short duration and the indicated rates of change are small, with an apparent reduction in crown density of 0.57% per annum in oak and 0.47% per annum in Norway spruce. The magnitudes of past increases in crown density in these species suggest that a single year of improvement could nullify the current trends.
Since 1991 the condition scores of Scots pine and Norway spruce have changed less than those of any of the other species. Although Norway spruce displayed no significant change in 2000, the condition of Scots pine showed a slight improvement. Following a sharp decline in 1997, the condition of Sitka spruce began to improve in 1999 and this recovery continued in 2000. Oak also improved this year, reversing the slight deterioration recorded in 1999, and was in better condition than at any time since 1995. However, it is still markedly poorer than during the late 1980s. The decline in beech recorded in 2000 completely reversed the improvement recorded in 1998 and crown density was reduced to the lowest level recorded since 1991.
Table 1: Percentages of trees in each crown density class for five species in 2000. Each 10% class represents a reduction in crown density compared either to an ‘ideal tree’ (I), i.e. a tree with the maximum possible amount of foliage, or to a ‘local tree’ (L), i.e. a tree with full foliage under local conditions.

Figure 1: Changes in crown density since 1987 for five species surveyed annually. The crown density compared with that of an ‘ideal’ tree with a completely opaque crown is shown for each species.

Figure 2 shows the geographical variation in crown density for the five species assessed. Variation was greatest in oak, which has shown substantially the same pattern since 1997 when data were first presented in this way (Redfern et al., 1998; 1999; 2000). Oak was again poorest in central Scotland and north-east England, south-west England, Wales and East Anglia, and best in southern England. Scots pine also displayed a pattern that was similar to those in previous years, with crown density tending to be highest south of the Humber-Mersey line. Beech showed no clear pattern. Both spruces were poorest in the south and east than elsewhere, but this impression is created by relatively few plots and both species show considerable local variation.
Factors affecting crown condition in 2000
Over much of the country April and the beginning of May were extremely wet but the consistent cloud cover over this period contributed to the absence of damaging spring frosts. Unprecedented high winds in mid-June resulted in shoot loss and browning of current year needles in two Norway spruce and four Sitka spruce plots in the north of the UK. In spite of extremely dry weather over much of Scotland in July, no drought damage to forest trees was reported. The remainder of the growing season was generally warm and wet.
The deterioration in beech this year was of similar magnitude to former declines in 1990 and 1995 (Figure1). As in these previous cases (Redfern et al., 1996), the reduction in crown density in 2000 was associated with heavy mast production (Table 2). Although the deterioration in the condition of beech and the increased fruiting noted in 1990 were considered as separate manifestations of stress caused by the drought of 1989 (Innes & Boswell, 1991), neither the 1995 nor 2000 growing season were preceded by drought years. However, since female flowers and subsequently fruits occupy positions which might otherwise give rise to vegetative shoots bearing foliage, heavy fruiting alone may bring about a reduction in crown density.
Although the condition of oak is better than for several years, it is still poorer than any of the other species surveyed. As in previous years, this appears to be due largely to insect damage which was recorded in 74 of the 85 plots assessed. Plots with low crown density were generally those in which insect activity was scored as heavy or severe, although oak dieback (Gibbs, 1999) appeared to be the primary cause of poor condition in four plots in England.
The condition of Sitka spruce improved slightly compared to last year. There were few reports of major damage by green spruce aphid and scores for insect damage remained at the low levels recorded in1999, suggesting that Sitka spruce is continuing a gradual recovery from the severe Elatobium outbreak of 1997. Exposure injury and abrasion by wind were reported from 13 Sitka spruce and 23 Norway spruce plots. The condition of Norway spruce was virtually unchanged in 2000, with only minor damage from insects and fungi being recorded.
The improvement in Scots pine this year reflected a marked increase in the number of trees in the lowest defoliation classes (0–20% reduction in crown density) despite levels of damage from the pine shoot beetle(Tomicus piniperda) and by the fungi Lophodermium seditiosum and Peridermium pini which were similar to those recorded in 1999. However, counts of needle retention demonstrated a marked increase in the number of trees retaining needles for 2 or more years in 2000.
Geographical variation in crown density for five species in 2000
Conclusions
Apart from a relatively short dry period over the north of the country in July, rainfall was well distributed throughout the growing season and tree growth was generally good. Unseasonal high winds in June caused localised damage to Sitka spruce and Norway spruce in Scotland but no other forms of climatic injury were important this year. Changes in crown density were minor in all species except beech, the condition of which deteriorated significantly. However, this change was associated with heavy mast production, which has been recorded during previous episodes of sharp reduction in beech crown density, and is not necessarily an indication of ill health. A slight improvement in condition this year suggests that Sitka spruce is continuing a gradual recovery from the severe outbreak of Elatobium which affected it in 1997. Oak, although better in 2000 than for several years, is still in poorer condition than the other surveyed species. Crown density in Norway spruce has displayed only minor fluctuations since1991 and remained virtually unchanged in 2000. Scots pine improved slightly, largely due to an increase in the number of needle years retained by trees.

